
Finding the degrees of freedom in statistical analyses is essential. It guides how we interpret data. This blog post delves into the concept of degrees of freedom. We’ll cover its definition, how to calculate it, and its significance in various statistical tests. Our aim is to make this concept clear and applicable for you, whether you’re a student, researcher, or data analyst.
What Are Degrees of Freedom?
Table of Contents
Degrees of freedom (DF) are a crucial concept in statistics. They refer to the number of independent values in a data set that can vary. But, there’s a catch. These values must adhere to a given set of constraints. For example, in estimating a parameter, the degrees of freedom are the number of values free to vary, after considering the constraints imposed.
Understanding degrees of freedom helps in grasping how constrained a statistical estimate is. It affects the shape of various sampling distributions. These include the t-distribution, which is pivotal in many statistical tests.
The Importance of Degrees of Freedom
Why do degrees of freedom matter? They play a key role in determining the critical values for statistical tests. These tests include t-tests, chi-square tests, and ANOVA. The degrees of freedom influence the shape and spread of the t-distribution. In turn, this affects the calculation of p-values and confidence intervals.
In essence, degrees of freedom help us understand how much ‘wiggle room’ our data has. They also provide insights into the reliability of our statistical estimates.
Calculation:
The formula for calculating degrees of freedom varies. It depends on the statistical test or context. Here, we’ll cover a few common scenarios:
- For a single sample: The degrees of freedom are �−1, where � is the sample size. This accounts for the constraint that the sample mean is a fixed value.
- In a two-sample t-test: The degrees of freedom can be more complex. They depend on the sample sizes and variances of the two groups. A common approximation is ��=�1+�2−2, where �1 and �2 are the sample sizes.
- In regression analysis: The degrees of freedom are �−�, where � is the number of observations and � is the number of independent variables (including the intercept).
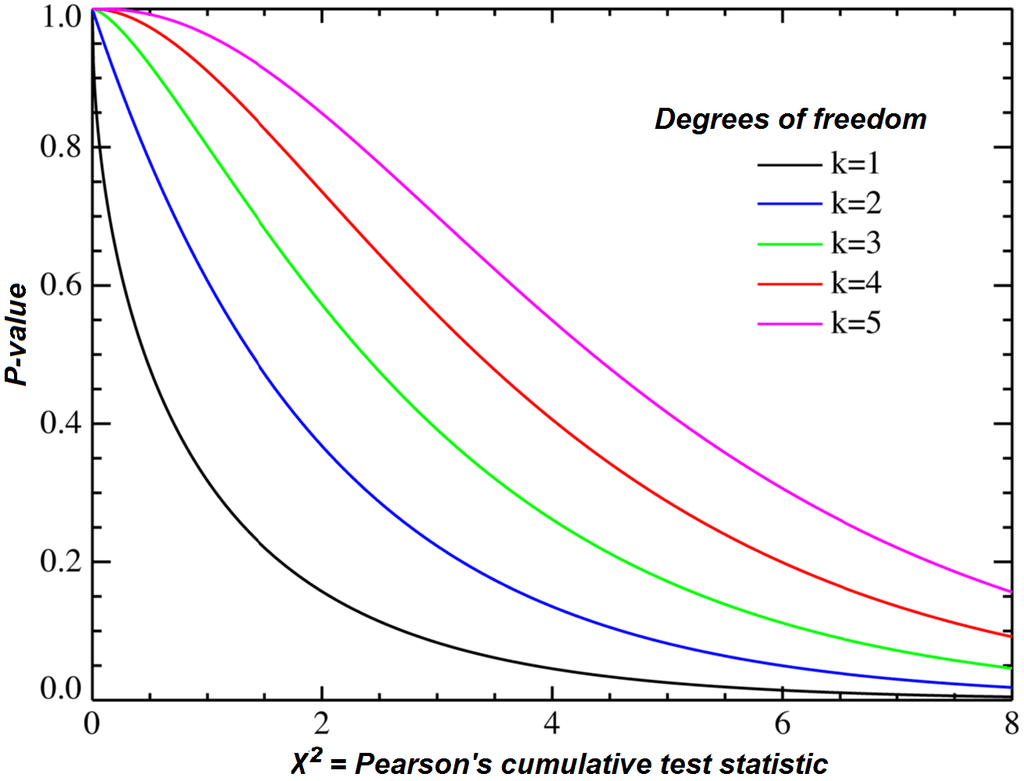
- For a chi-square test: The degrees of freedom are determined by the number of categories or cells in a contingency table, minus the constraints.
Detail Formulas
Below is a table that outlines the formulas for calculating degrees of freedom in various statistical contexts:
| Statistical Context | Formula for Degrees of Freedom | Notes and Constraints |
|---|---|---|
| Single Sample | ��=�−1 | � is the sample size. |
| Two-sample t-test (equal variances) | ��=�1+�2−2 | �1 and �2 are the sample sizes. |
| Two-sample t-test (unequal variances) | Approximated by Welch-Satterthwaite equation | Complex; depends on sample sizes and variances. |
| Paired t-test | ��=�−1 | � is the number of pairs. |
| ANOVA | ���������=�−1, �����ℎ��=�−� | � is the number of groups, � is total number of observations. |
| Chi-square test | ��=(�−1)(�−1) | � and � are the number of rows and columns in the contingency table. |
| Regression analysis | ��=�−� | � is the number of observations, � includes the number of predictors plus the intercept. |
This table serves as a quick reference for calculating degrees of freedom in various statistical tests.
Frequently Asked Questions
Why do we subtract 1 for a single sample’s degrees of freedom?
In a single sample, we subtract 1 from the sample size to account for the fixed sample mean. This ensures that our estimate is unbiased and reflects the true variability in the data.
How does the concept of degrees of freedom apply to regression analysis?
In regression analysis, degrees of freedom are tied to the number of predictors. They help us understand the model’s complexity. The more predictors we have, the fewer degrees of freedom remain. This affects the model’s flexibility.
Why do degrees of freedom matter in hypothesis testing?
Degrees of freedom are crucial in hypothesis testing. They determine the critical values for deciding if a result is statistically significant. They also influence the shape of the distribution used for calculating p-values.
How do unequal variances in a two-sample t-test affect degrees of freedom?
When variances are unequal, the degrees of freedom can be less intuitive. They’re often approximated using the Welch-Satterthwaite equation. This adjustment ensures that the t-test remains valid under the condition of unequal variances.
Conclusion
Understanding degrees of freedom is essential in statistical analysis. It’s a concept that underpins many statistical tests and procedures. Whether you’re dealing with t-tests, ANOVA, regression analysis, or chi-square tests, degrees of freedom offer insights into the reliability and precision of your statistical estimates.
In this post, we’ve explored the definition, significance, and calculation of degrees of freedom across various contexts. We’ve also answered some frequently asked questions to clarify common doubts.
If you have more questions or need further assistance with statistical concepts, don’t hesitate to contact us. Our team is here to help you navigate the complexities of data analysis and statistical inference.